
PERFORMANCE. It's what mutual fund investing is all about. So to keep you
abreast of how various types of equity funds are performing, which funds are
leaders and laggards and how the largest funds are doing, that information is
now just a click away.
| Mutual fund performance data thankfully supplied to us by Lipper, Inc. |  |

 | Lipper Weekly U.S. Fund Flows Video Series—December 11, 2019
For the third week running, investors were overall net purchasers of fund assets (including those of conventional funds and ETFs), injecting $38.9 billion for Lipper’s fund-flows week ended December 11, 2019. Fund investors were net purchasers of money market funds (+$39.0 billion), taxable fixed income funds (+$5.6 billion), and municipal bond funds (+$1.6 billion). However, they were net redeemers of equity funds (-$7.1 billion) this week. Tom Roseen highlights the weekly flows trends for both conventional funds and ETFs in this video series. |
| U.S. Weekly FundFlows Insight Report: Fund Investors Take Their Foot Off the Pedal while APs Remain Engaged During the Week
For the third week running, investors were overall net purchasers of fund assets (including those of conventional funds and ETFs), injecting $38.9 billion for Lipper’s fund-flows week ended December 11, 2019. Fund investors were net purchasers of money market funds (+$39.0 billion), taxable fixed income funds (+$5.6 billion), and municipal bond funds (+$1.6 billion). However, they were net redeemers of equity funds (-$7.1 billion) this week. |
| Lipper Weekly U.S. Fund Flows Report – December 4, 2019
Lipper’s fund asset groups (including both mutual funds and exchange-traded funds) recorded net inflows of $29.2 billion for the fund-flows trading week ended Wednesday, December 4. This was the thirteenth week out of the last 14 in which funds took in net new money. All four fund asset groups experienced net positive flows for the second consecutive week, paced by money market funds, which grew their coffers by $22.4 billion. Equity funds, taxable bond funds, and municipal bond funds contributed $5.0 billion, $1.2 billion, and $615 million, respectively, to the week’s total net inflows. Pat Keon, CFA speaks to the highlights in this week’s video. |
| Lipper U.S. Weekly FundFlows Insight Report: All Fund Asset Groups Contribute to the Week’s Net Inflows
Lipper’s fund asset groups (including both mutual funds and exchange-traded funds) recorded net inflows of $29.2 billion for the fund-flows trading week ended Wednesday, December 4. This was the thirteenth week out of the last 14 in which funds took in net new money. All four fund asset groups experienced net positive flows for the second consecutive week, paced by money market funds, which grew their coffers by $22.4 billion. Equity funds, taxable bond funds, and municipal bond funds contributed $5.0 billion, $1.2 billion, and $615 million, respectively, to the week’s total net inflows. |
 Now, more numbers than ever! Over 600 fund families listed.
 Privacy. It's really important and Fundfreebies takes the subject very seriously.
|


POCKETBOOK Week Ending May 31, 2019
I’m on vacation - After more than 20-years of writing this weekly blog, I’ve decided to take the month of June off. No blog. No market or mutual fund update. No opinion. Not sure how successful I’ll be at keeping my fingers off the keyboard but I’ll give it a try.
(Source: allaboutfundsdotcom Blog) |
|
|

POCKETBOOK Week Ending May 17, 2019
Happy Spenders and our Great(?) Economy - Whoa. I was at the brand new multi-thousand foot At Home décor store yesterday in North Palm Beach, FL. The hugely huge parking lot was jammed as were the too-many-to-count aisles. As you might imagine, the check-out line snaked around and you would have thought the joint was giving away stuff. They weren’t.
(Source: allaboutfundsdotcom Blog) |
|
|

| The Importance of End-of-Life Estate Planning
Jane Brown, a Wills and Estate attorney at Gunster in Palm Beach, FL talks about the importance of end-of-life estate planning along with common misperceptions and issues everyone needs to consider |
| Tim Harris on Today's Health Care Shortage
Tim Harris, FSA, MAAA and co-chairperson of the Society of Actuaries Committee on the Living to 100 Symposium, talks about today's healthcare shortage and America's shortage of doctor and nurses. |
| Retirement and Working Longer
Anna Rappaport, FSA, MAAA and president of Anna Rappaport Consulting, was one of the presenters at the Society of Actuaries "Living to 100" program held in Orlando earlier this year. |
| Video Archive » |
|


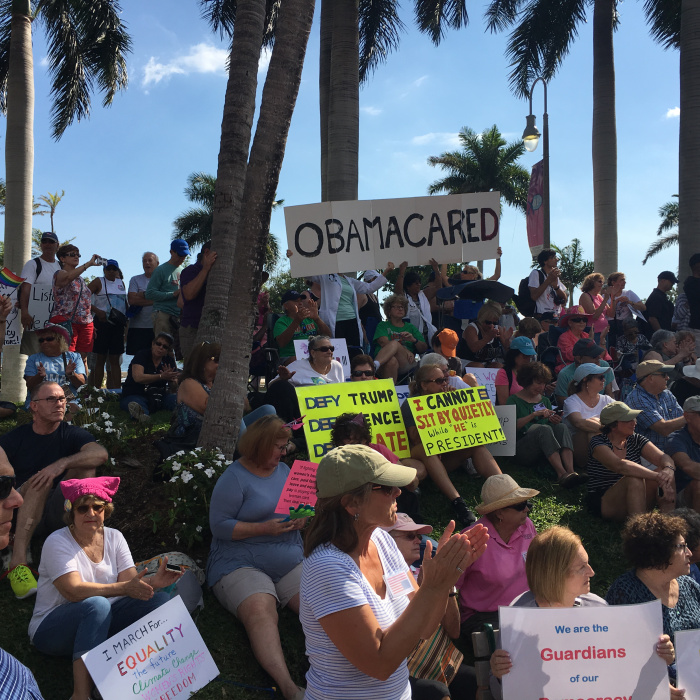
TrumpBits#33: Trump gets his Wall
Over the past few years, candidate and now President Trump has been talking about building a wall to protect us. Now, two years into his presidency, a wall has appeared. It’s a wall created by Trump and paid for by the American public. How long it will stand is anybody’s guess.
(Source: allaboutfundsdotcom Blog) |
|
|

|


