Bulls, bears debate value of gold investing
The decade: Sorting out financial winners, losers
By DIAN VUJOVICH
Special to the Palm Beach Daily News
December 26, 2009
Looking for a positive spin for the first decade of the 21st century is like deciding whether the glass is half-empty or half-full. Of course, your perspective hinges on what's in the glass: Like its contents and the past may look full; dislike it and it's an ugly scenario. Truth be revealed, the decade reflects a bit of both.
It began with enormous worries the world would end Jan. 1, 2000, thanks to the calendar and computer glitches. Those in the not-so-know managed to scare nearly everyone into thinking the programs in their computers would go kaput, causing a catastrophic worldwide meltdown. The programs weren't supposed to distinguish between one day and 100 years.
The concern for the financial industry was unfounded. Except for a few people who made big money from Y2K fever, most of us got nothing but more gray hairs worrying about it. Which, in effect, sums up the ending decade: some made plenty of money; others worried sick about what they lost.
Here's a look back at how our demographics -- and markets -- changed during a decade that began and ended with a Democrat in the White House.
The demographics
Our population is changing. While there is plenty of grousing about government taking too much control in people's lives, its hand can't help but get larger as the population increases, the disparity between income levels widens and life spans grow. Unless, of course, you're a nation of huge savers -- which we aren't.
Throw in the unexpected and extra costs of uncertainties such as war or natural disasters, and managing a government isn't that different from managing your household: The more children you have, the more bills you'll have, the more money it takes and the more management that is required.
In 2000, 281,422,426 people lived in the United States. In July 2009, the number had grown to 307,212,123, according to census figures. That's up by about 26 million, an increase of about 8.5 percent.
Roughly 34 million Americans were living below the poverty level in 2000. In 2008, that figure was about 40 million. Today, due to current economic problems, it is likely higher.
Add to population growth the fact we are living longer than we were a decade ago, with women outliving men, and today's life span costs more. Overlooking medical care and drug costs, the simple things cost more too: Stamps cost 33 cents in 2000; now they cost 44 cents. A gallon of unleaded gasoline cost $1.51 in 2000; today it costs $2.65. The minimum hourly wage in 2000 was $5.15; today it's $7.25.
Add new words that reflect our changing lifestyles into the picture: app, blog, Crocs, twitter, Wii, Zhu-Zhu. Then there are words that have affected the deficit: TARP, the Iraq War and 9/11.
Our money
We've got a lot more debt to deal with today than we had in 2000. That year, the federal government enjoyed a budget surplus of nearly $240 billion.
Today, not so. Not even close.
No need to mention the national debt -- but it's about $12 trillion and will take years to get our arms around.
It's almost hard to believe what was written in a White House paper from The Briefing Room published Dec. 28, 2000, when Bill Clinton was president: "The United States can be debt-free this decade. By dedicating the entire budget surplus to debt reduction, The United States can eliminate its publicly held debt by FY 2009. The next Administration and Congress will need to decide what priorities to address: eliminate the public debt by FY 2010 and still use part of the surplus for responsible tax cuts, prescription drug benefits for Medicare recipients, and investments in key priorities like education and health care ..."
How things can change
There are more billionaires today than 10 years ago -- 360 to 298. Millionaires too. A 2009 Affluent Market Insights report cited 6.7 million households with a net worth of $1 million or more (not including the value of their primary residence) in 2008. In 2007, it was 9.2 million households. In 2000, another source reported about 4 million millionaires in the United States.
The price of gold in 2000 was a measly $272 per ounce. Now it's off this year's high of $1,200 and sits near $1,090. Oil began the decade at roughly $27 a barrel; today, reverse those numbers: it's $72 a barrel.
Throughout the decade the markets have seen two big bears walk the Street, real estate bubbles, and all sorts of scandals involving corporate big wigs and Ponzi schemers. The always preached buy-and-hold investment strategy hasn't yielded much, averaging less than 1 percent per year for the decade. Taxable money market funds began the century yielding about 5.8 percent. Today they give a tiny fraction of that -- less than 1 percent.
Stock market winners
The Dow Jones Industrial Average has done little to please many this decade. On Dec. 31, 1999, it was about 11,500; now, Dec. 23, 2009, it's about 1,000 points lower: 10,456.
People have made money. Just not everybody.
Mergers and acquisitions brought in bundles, particularly during the early years of the decade and before huge investment banks such as Lehman Brothers crashed.
And so have some stocks. Those mentioned in Louis Navellier's Dec. 14 Blue Chip Growth newsletter (with comparisons based on their closing prices Dec. 31, 1999) include:
- AmBev (ABV) -- The American Beverage Co. based in Latin America owns familiar names such as Pepsi brands and Lipton iced tea. Its per-share price realized a gain of 850 percent over the decade.
- Cognizant Tech Solutions (CTSH) -- This outsourcing firm saw its per-share price gain 870 percent.
- Express Scripts (ESRX) -- This stock was up more than 980 percent. It's North America's leading provider of pharmacy benefit management services.
- Gold -- This metal was golden over the past decade as the mining company GoldCorp (GG) saw its per-share prices rise 1,430 percent.
- Southwestern Energy (SWN) -- This stock gained a whopping 4,900 percent.
Stock market losers
On the other hand, these four stocks saw their per-share price drop more than 90 percent during the decade, according to CNBC.com on Dec. 21.:
- JDS Uniphase Corp (JDSU) was down almost 99 percent.
- American International Group (AIG) was off 98 percent.
- Sun Microsystems (JAVA) lost 94 percent.
- E*Trade (ETFC) lost 93.2 percent.
So while the buy-and-hold strategy didn't reward most investors, a few stocks did. But most fell short of even modest expectations.
For fixed-income investments, bonds were the deal for the decade. Ibbotson reported that from 2000 through November 2009, bonds gained between 5.6 and 8 percent, depending on the sector. (Remember, yields were higher at the beginning of the decade. As interest rates fall, the value of the bond increases.)
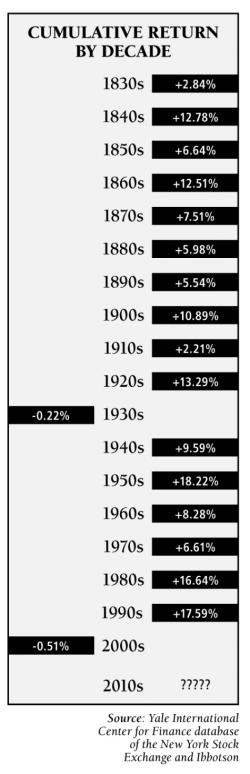
Pros are quick to say this decade will turn out to be the worst for stocks since the 1820s. The decade may have been financially challenging and imposed some lifestyle changes for you and your loved one, but money challenges don't kill you. It's how and what we think about money that can cause the most damage.
Here's hoping we've learned some things from the first decade of the century, namely: diversification between stocks and bonds makes sense, deals too good to be true often are, and buy-and-hold is not the only investment strategy that pays off. Trading can too, and, as they say on Wall Street, trees don't grow to the sky.
May the next 10 years bring more financial rewards for us all. But if they don't, we'll survive and adapt. It's the American way.
That makes the glass half-full.
To read more articles, please visit the column archive.